🌸桜の開花
はじめに
多くの場合、私たちが適合させたいモデルに、xとy間の完全な直線はありません。代わりにモデルのパラメータはxに対して変化することが予期されます。この状況をうまく扱う方法がいくつかあります。その一つがスプラインを適合することです。スプラインの適合は、多重の個別の曲線の効果的な合計になります。その個別の曲線はxの異なるセクションにそれぞれに適合し、それらの境界を互いに結んで、しばしば節目(knots)と呼ばれます。
スプラインは個々のラインを効果的に多重化します。xの異なるセクションの各適合は、互いにその境界を結びつけて、しばしば節目(knots)と呼ばれます。
以下はpyMCを用いたスプラインを適合する方法の完全な実行例です。データとモデルは Statistical Rethinking 第二版 Richard McElreath から引用しています。
Statistical Rethinkingは、RとStanの実装例で記述されています。ここでは同じデータを用いてPythonとpyMCの実装を示します。
Statistical Rethinking 2nd edition. McElreath,2018
from pathlib import Path

import arviz as az
import matplotlib.pyplot as plt
import numpy as np
import pandas as pd
import pymc as pm

from patsy import dmatrix
%matplotlib inline
%config InlineBackend.figure_format = "retina"
RANDOM_SEED = 8927
az.style.use("arviz-darkgrid")桜の開花データ
この例で用いるデータは、各年で桜の木が開花した日数("days of year" 以下 doy)です。便宜上、doyが欠損している年はデータから省きます。(一般的に欠損データを処理するのは不適切な考えです。)
データを読み込んで表示させてみます。
try:
    blossom_data = pd.read_csv(Path("..", "data", "cherry_blossoms.csv"), sep=";")
except FileNotFoundError:
    blossom_data = pd.read_csv(pm.get_data("cherry_blossoms.csv"), sep=";")


blossom_data.dropna().describe()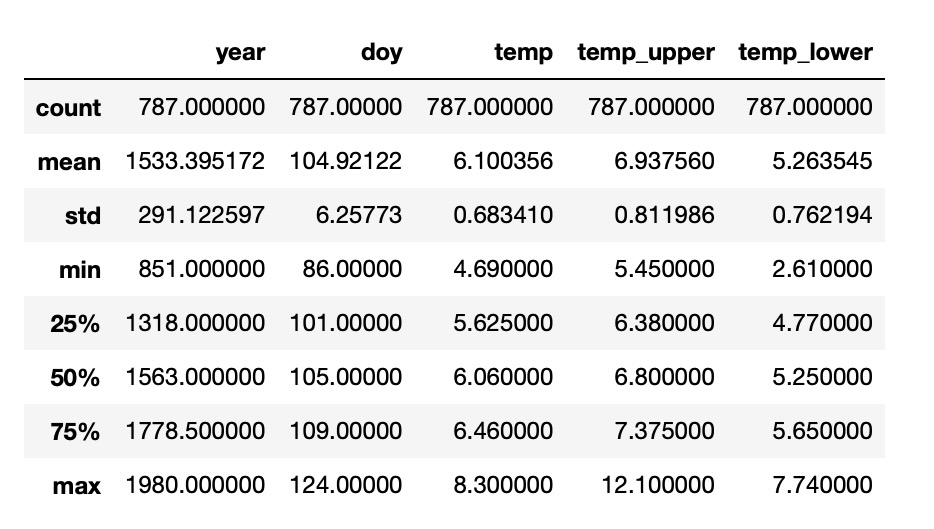
blossom_data = blossom_data.dropna(subset=["doy"]).reset_index(drop=True)
blossom_data.head(n=10)| year | doy | temp | temp_upper | temp_lower | |
|---|---|---|---|---|---|
| 0 | 812 | 92.0 | NaN | NaN | NaN |
| 1 | 815 | 105.0 | NaN | NaN | NaN |
| 2 | 831 | 96.0 | NaN | NaN | NaN |
| 3 | 851 | 108.0 | 7.38 | 12.10 | 2.66 |
| 4 | 853 | 104.0 | NaN | NaN | NaN |
| 5 | 864 | 100.0 | 6.42 | 8.69 | 4.14 |
| 6 | 866 | 106.0 | 6.44 | 8.11 | 4.77 |
| 7 | 869 | 95.0 | NaN | NaN | NaN |
| 8 | 889 | 104.0 | 6.83 | 8.48 | 5.19 |
| 9 | 891 | 109.0 | 6.98 | 8.96 | 5.00 |
欠損データの横列を省略した後、桜の木が開花した日数のある年が827年分あります。(yearは西暦です。)
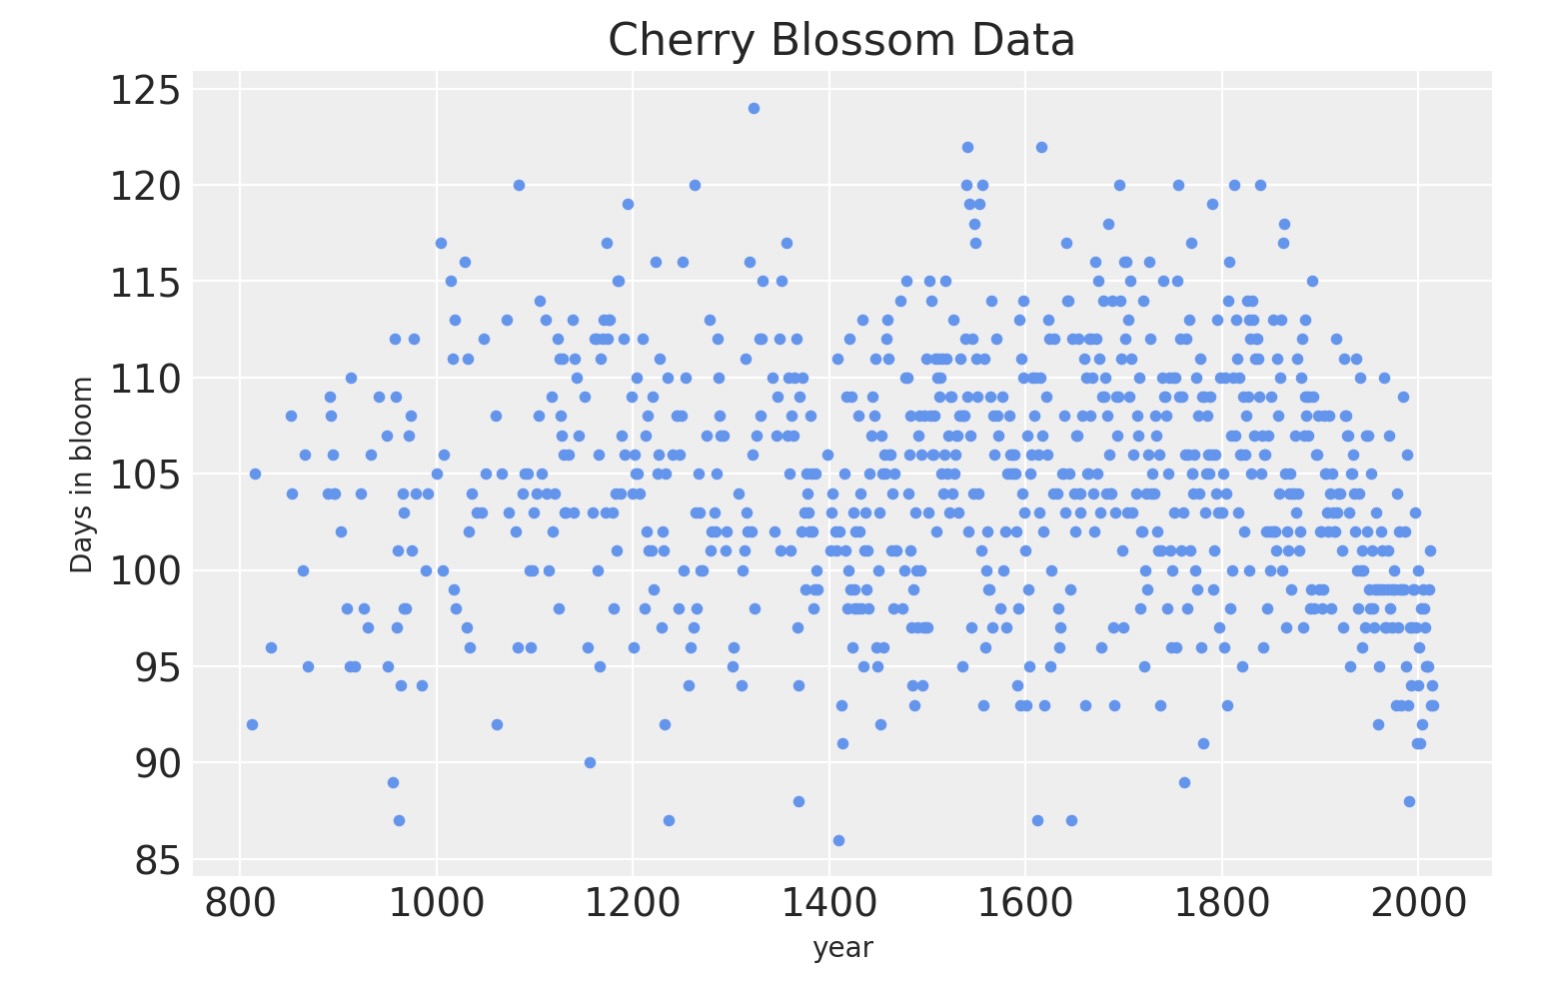
blossom_data.shape(827, 5)データを視覚化すると、たくさんの年毎の変動があるのは明白です。しかし、時間の経過で開花に非線形なトレンドがある証拠が見られます。
blossom_data.plot.scatter(
    "year", "doy", color="cornflowerblue", s=10, title="Cherry Blossom Data", ylabel="Days in bloom"
);
モデル
以下のモデルを適合させます。
D ~ N(μ, σ)
 μ = α B w
    α 〜 N(100, 10)
    w 〜 N(0, 10)
 σ 〜 Exp(1)
開花までの日数Dは、平均値μ、標準偏差σの正規分布としてモデル化されています。これに対して、平均値はy切片 αと基底の各領域の変分を持つモデルパラメータwで基底Bを乗算することによって定義されたスプラインからなる線形モデルになります。両者とも弱い事前正規分布を持っています。
スプラインの準備
スプラインは15の節目を持ちます。それは年を(私たちが持つデータのその年のカバーする領域の前後を含む)16のセクションに分割します。節目(knots)はスプラインの境界です。スプラインは、いかにしてその個別の線が、連続したスムーズな曲線を作るために、それらの境界で互いを結びつけるための名称です。節目は、各領域がデータの同じ割合を持つような年を超えた、不揃いの割合の期間になります。
num_knots = 15
knot_list = np.quantile(blossom_data.year, np.linspace(0, 1, num_knots))
knot_list
array([ 812., 1036., 1174., 1269., 1377., 1454., 1518., 1583., 1650.,
1714., 1774., 1833., 1893., 1956., 2015.])以下はデータを超えた節目の位置をプロットします。
blossom_data.plot.scatter(
    "year", "doy", color="cornflowerblue", s=10, title="Cherry Blossom Data", ylabel="Day of Year"
)
for knot in knot_list:
    plt.gca().axvline(knot, color="grey", alpha=0.4);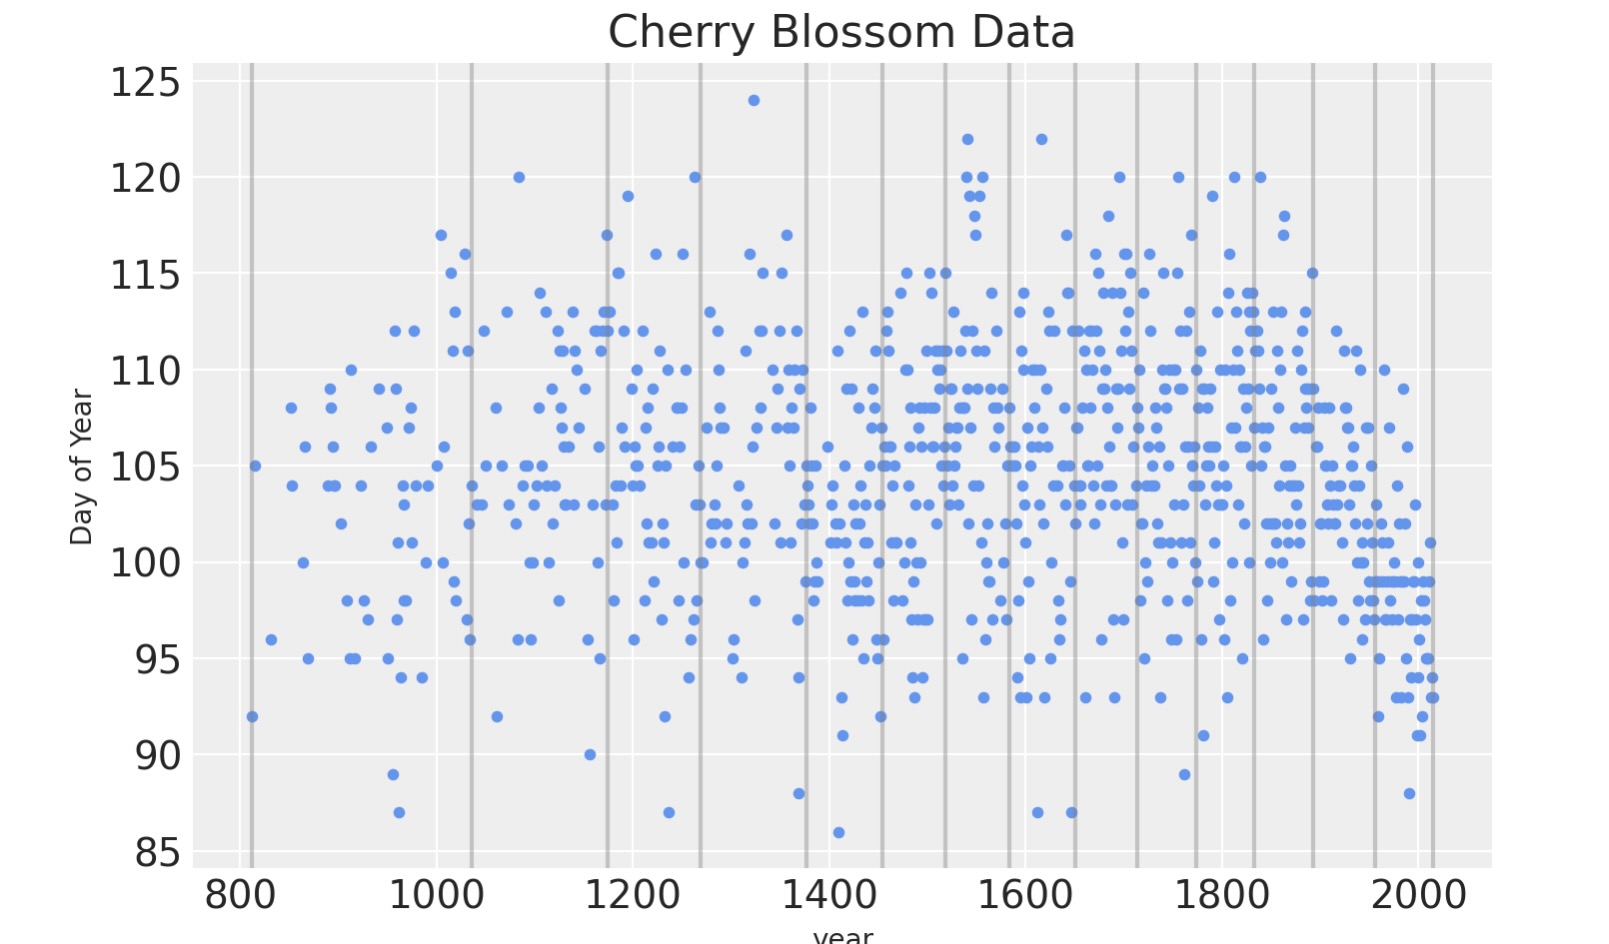
回帰の基になるb-splineになる行列Bを作るためにpastyを使うことができます。キュービックb-スプラインを作るためにdegreeを3に設定します。
B = dmatrix(
    "bs(year, knots=knots, degree=3, include_intercept=True) - 1",
    {"year": blossom_data.year.values, "knots": knot_list[1:-1]},
)
B
DesignMatrix with shape (827, 17)
Columns:
['bs(year, knots=knots, degree=3, include_intercept=True)[0]',
'bs(year, knots=knots, degree=3, include_intercept=True)[1]',
'bs(year, knots=knots, degree=3, include_intercept=True)[2]',
'bs(year, knots=knots, degree=3, include_intercept=True)[3]',
'bs(year, knots=knots, degree=3, include_intercept=True)[4]',
'bs(year, knots=knots, degree=3, include_intercept=True)[5]',
'bs(year, knots=knots, degree=3, include_intercept=True)[6]',
'bs(year, knots=knots, degree=3, include_intercept=True)[7]',
'bs(year, knots=knots, degree=3, include_intercept=True)[8]',
'bs(year, knots=knots, degree=3, include_intercept=True)[9]',
'bs(year, knots=knots, degree=3, include_intercept=True)[10]',
'bs(year, knots=knots, degree=3, include_intercept=True)[11]',
'bs(year, knots=knots, degree=3, include_intercept=True)[12]',
'bs(year, knots=knots, degree=3, include_intercept=True)[13]',
'bs(year, knots=knots, degree=3, include_intercept=True)[14]',
'bs(year, knots=knots, degree=3, include_intercept=True)[15]',
'bs(year, knots=knots, degree=3, include_intercept=True)[16]']
Terms:
'bs(year, knots=knots, degree=3, include_intercept=True)' (columns 0:17)
(to view full data, use np.asarray(this_obj))b-スプラインの基底を以下にプロットします。スプラインの各部分の領域を示します。曲線の高さは、対応するモデルの共通の変分がその領域のモデルの推定になる事に、どれくらい影響するかを示しています。節目に相当する重なる領域は、一つに領域から次の領域へいかに滑らかに転換するかを示すように形成されます。
spline_df = (
    pd.DataFrame(B)
    .assign(year=blossom_data.year.values)
    .melt("year", var_name="spline_i", value_name="value")
)

color = plt.cm.magma(np.linspace(0, 0.80, len(spline_df.spline_i.unique())))

fig = plt.figure()
for i, c in enumerate(color):
    subset = spline_df.query(f"spline_i == {i}")
    subset.plot("year", "value", c=c, ax=plt.gca(), label=i)
plt.legend(title="Spline Index", loc="upper center", fontsize=8, ncol=6);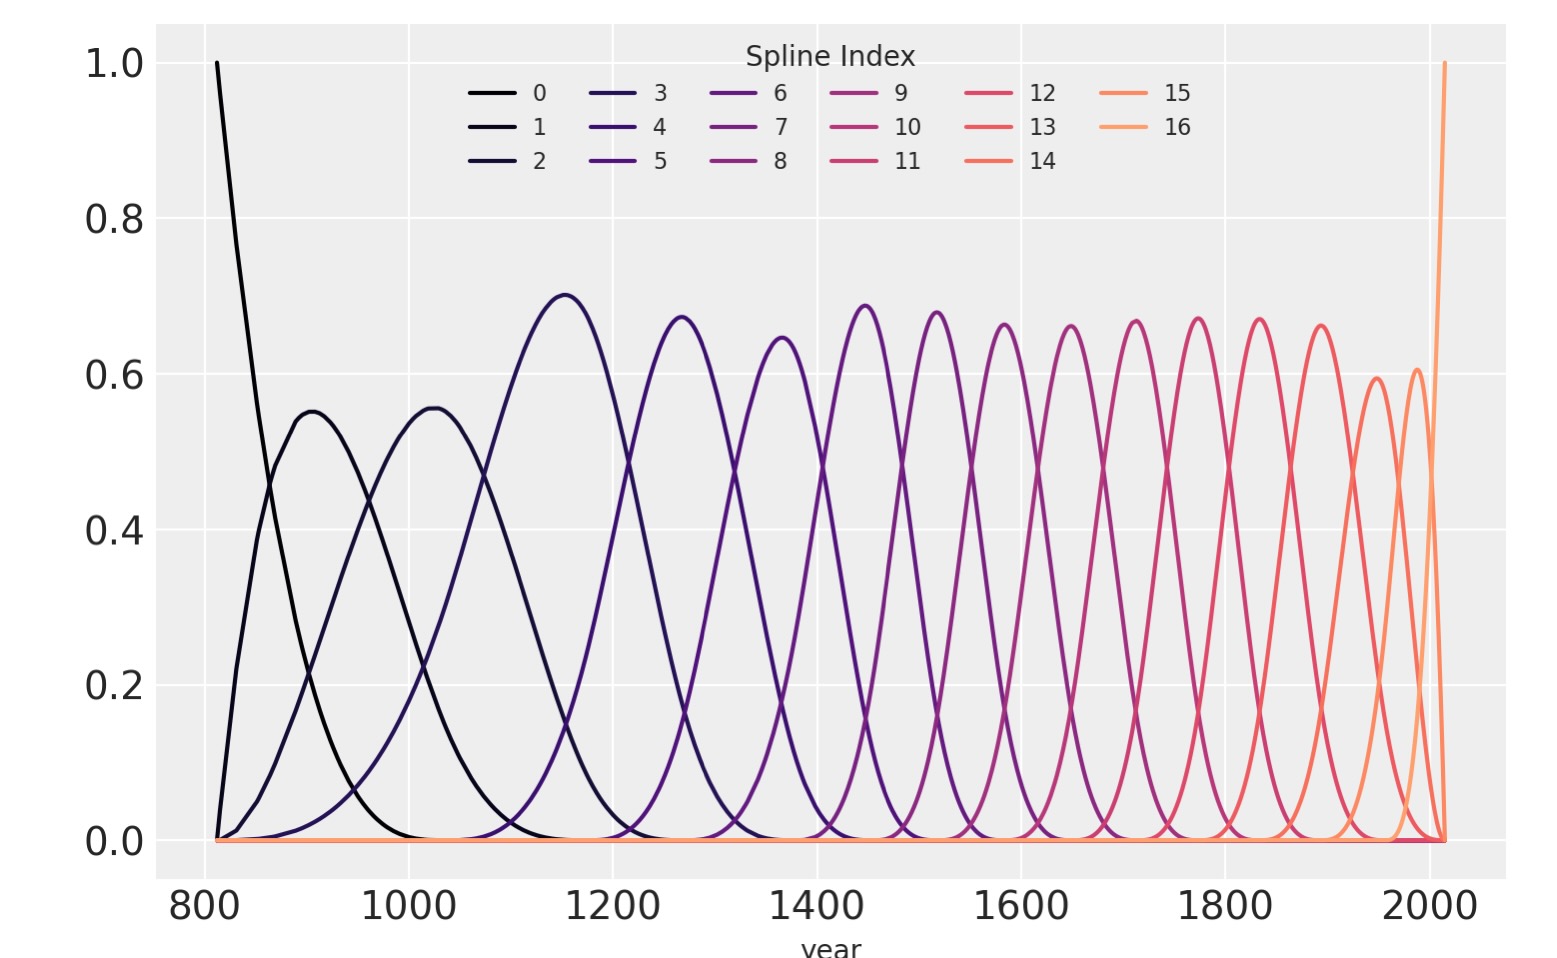
モデルを適合する
ついにモデルがPyMCを用いて作られます。図はモデルパラメータの構造を示しています。
COORDS = {"splines": np.arange(B.shape[1])}
with pm.Model(coords=COORDS) as spline_model:
    a = pm.Normal("a", 100, 5)
    w = pm.Normal("w", mu=0, sigma=3, size=B.shape[1], dims="splines")
    mu = pm.Deterministic("mu", a + pm.math.dot(np.asarray(B, order="F"), w.T))
    sigma = pm.Exponential("sigma", 1)
    D = pm.Normal("D", mu=mu, sigma=sigma, observed=blossom_data.doy, dims="obs")
pm.model_to_graphviz(spline_model)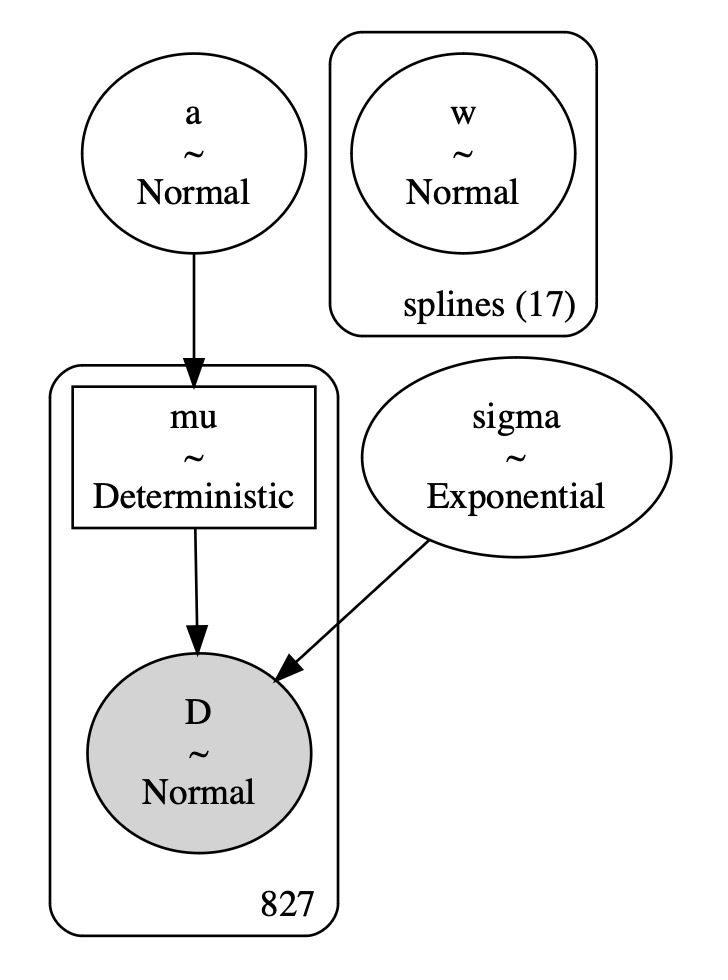
with spline_model:
    idata = pm.sample_prior_predictive()
    idata.extend(pm.sample(draws=1000, tune=1000, random_seed=RANDOM_SEED, chains=4))
    pm.sample_posterior_predictive(idata, extend_inferencedata=True)
分析
モデルの事後出力を分析します。
以下のテーブルはモデルパラメータの事後分布をまとめたものです。事後のパラメータは、wは幅広いのですが、αとσは全く細い幅になってます。これは、全てのデータポイントがαとσの推定に使われた一方で、サブセットがwの各値に使われたためである可能性が高そうです。(情報の共有を許し、スプラインを横切って制限を追加するこれらの階層化モデルの興味深さです。)効果的なサンプルサイズとR値は全て良い結果で、モデルは収束し、事後分布からよくサンプルされています。
az.summary(idata, var_names=["a", "w", "sigma"])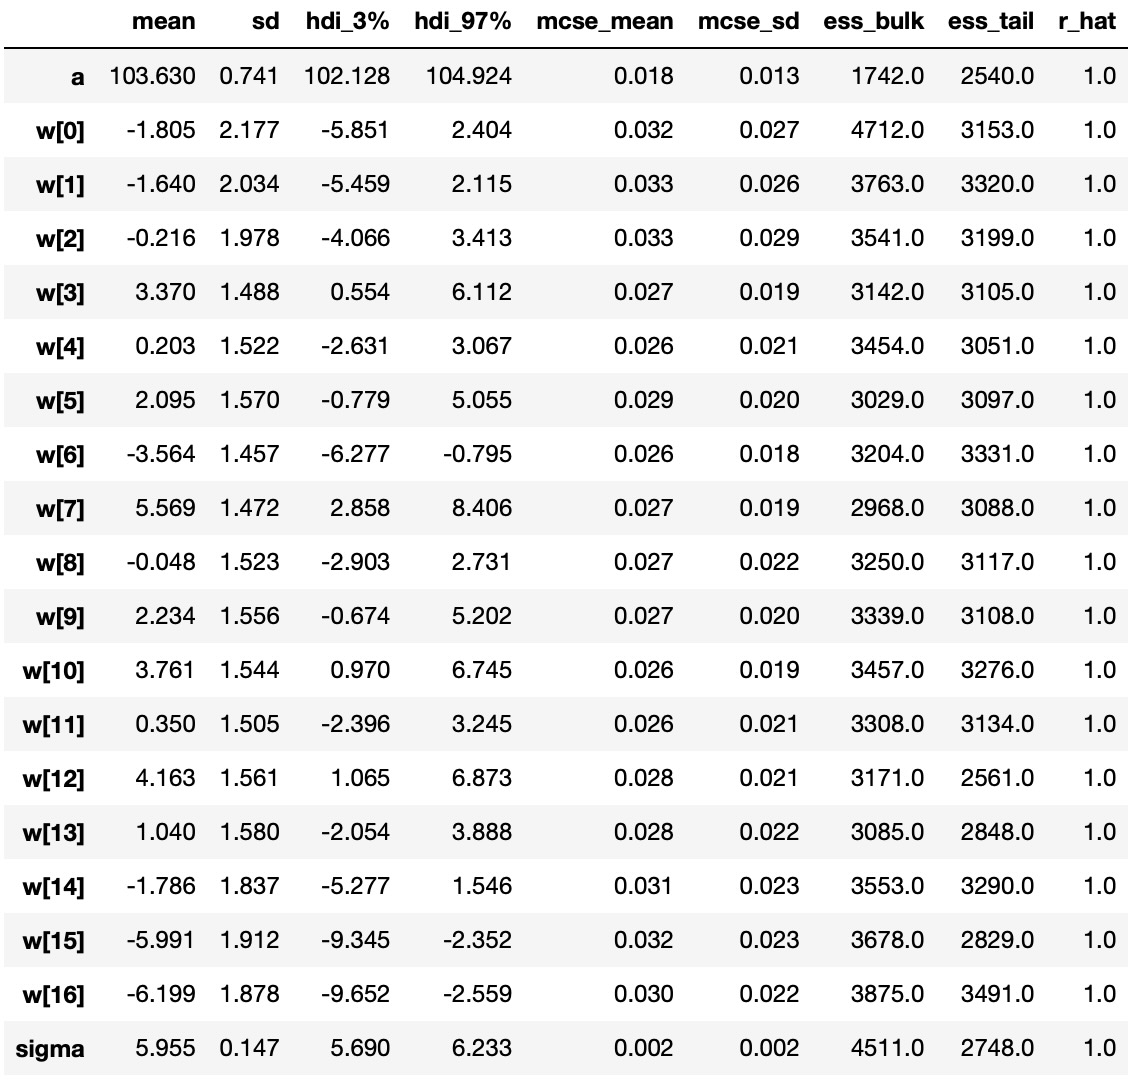
モデルパラメータのトレースプロットは良い結果です(同質でトレンドがなく)その上、チェインが混合して収束することを示しています。
az.plot_trace(idata, var_names=["a", "w", "sigma"]);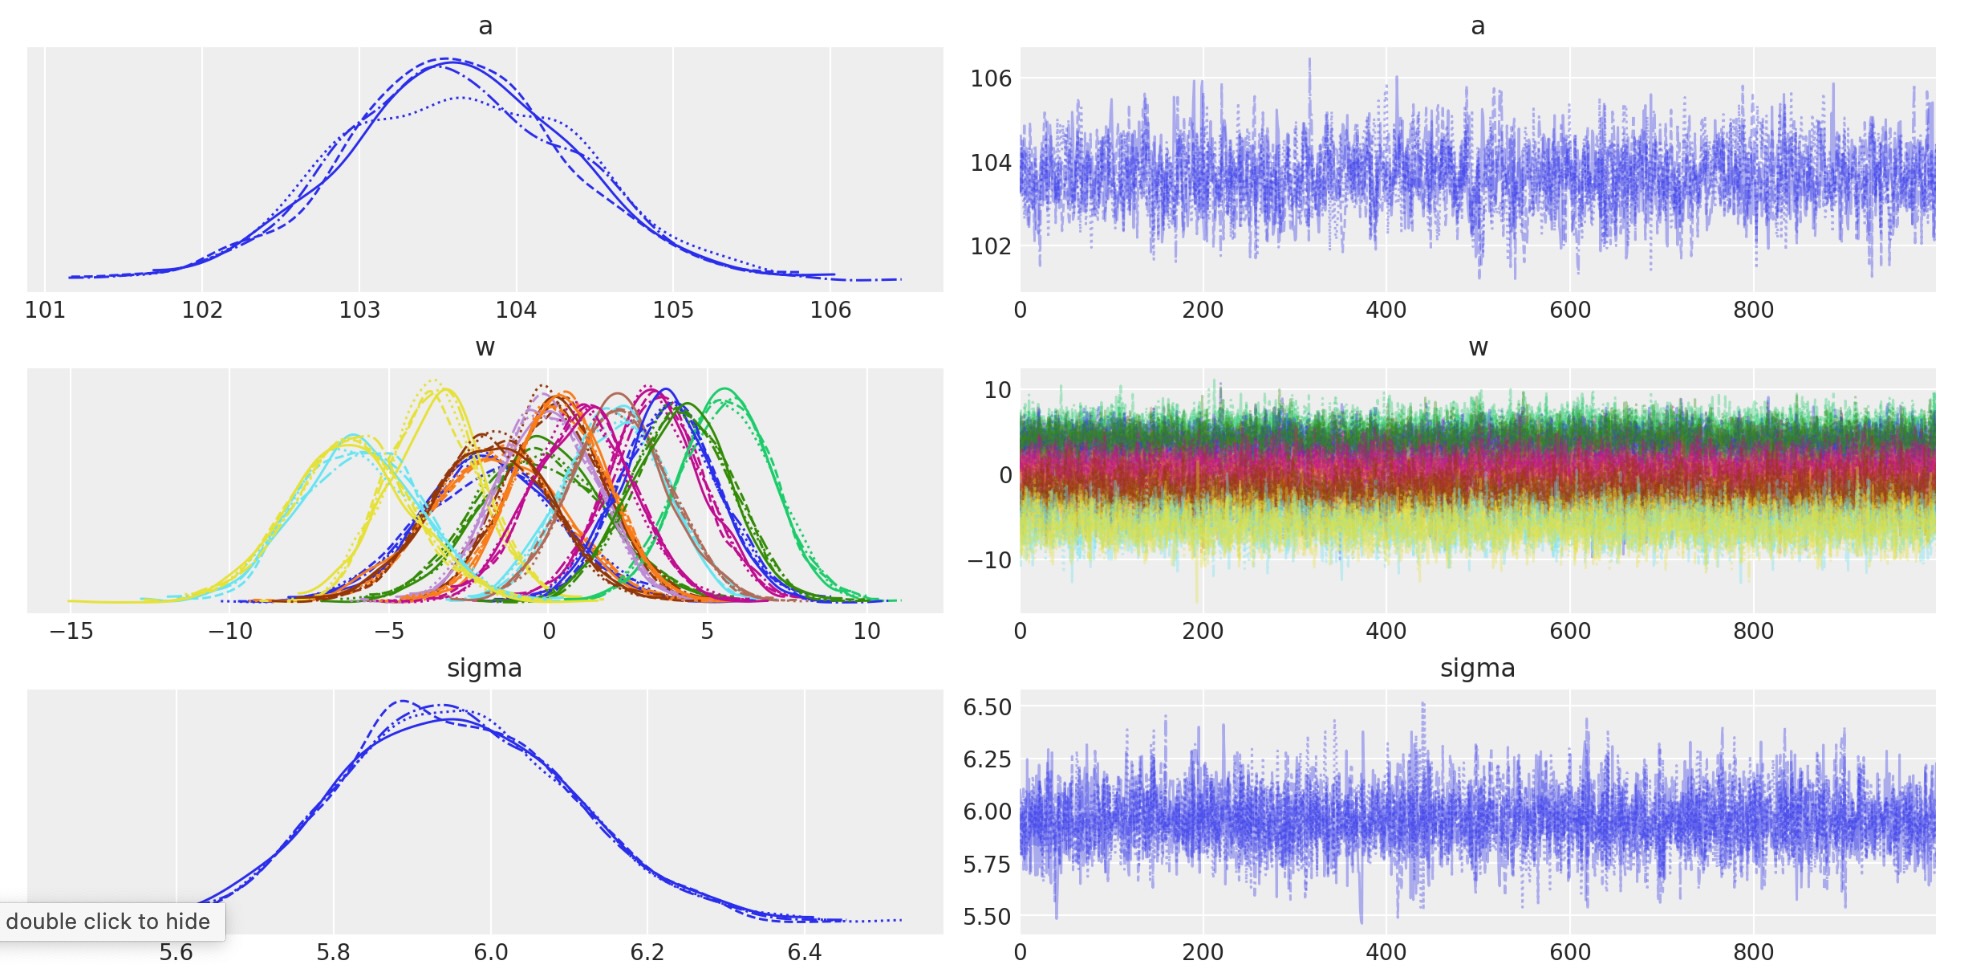
az.plot_forest(idata, var_names=["w"], combined=False, r_hat=True);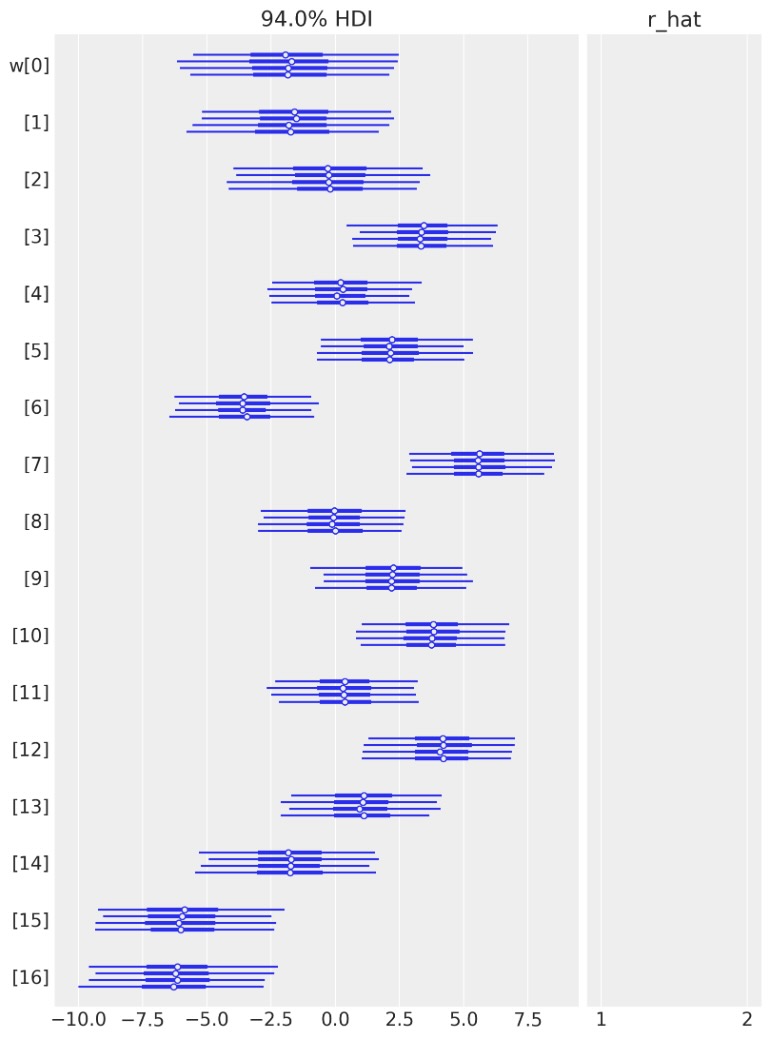
スプライン値の適合の他の視覚化は、基底行列に対してそれらを乗算してプロットすることがあります。節目(knots)の境界は再度、縦の線で示されますが、スプラインの基底はwの値に対して乗算されます。Bとwの乗算値は-実際に線形モデルとして計算-黒色で示されます。
wp = idata.posterior["w"].mean(("chain", "draw")).values

spline_df = (
    pd.DataFrame(B * wp.T)
    .assign(year=blossom_data.year.values)
    .melt("year", var_name="spline_i", value_name="value")
)

spline_df_merged = (
    pd.DataFrame(np.dot(B, wp.T))
    .assign(year=blossom_data.year.values)
    .melt("year", var_name="spline_i", value_name="value")
)


color = plt.cm.rainbow(np.linspace(0, 1, len(spline_df.spline_i.unique())))
fig = plt.figure()
for i, c in enumerate(color):
    subset = spline_df.query(f"spline_i == {i}")
    subset.plot("year", "value", c=c, ax=plt.gca(), label=i)
spline_df_merged.plot("year", "value", c="black", lw=2, ax=plt.gca())
plt.legend(title="Spline Index", loc="lower center", fontsize=8, ncol=6)

for knot in knot_list:
    plt.gca().axvline(knot, color="grey", alpha=0.4);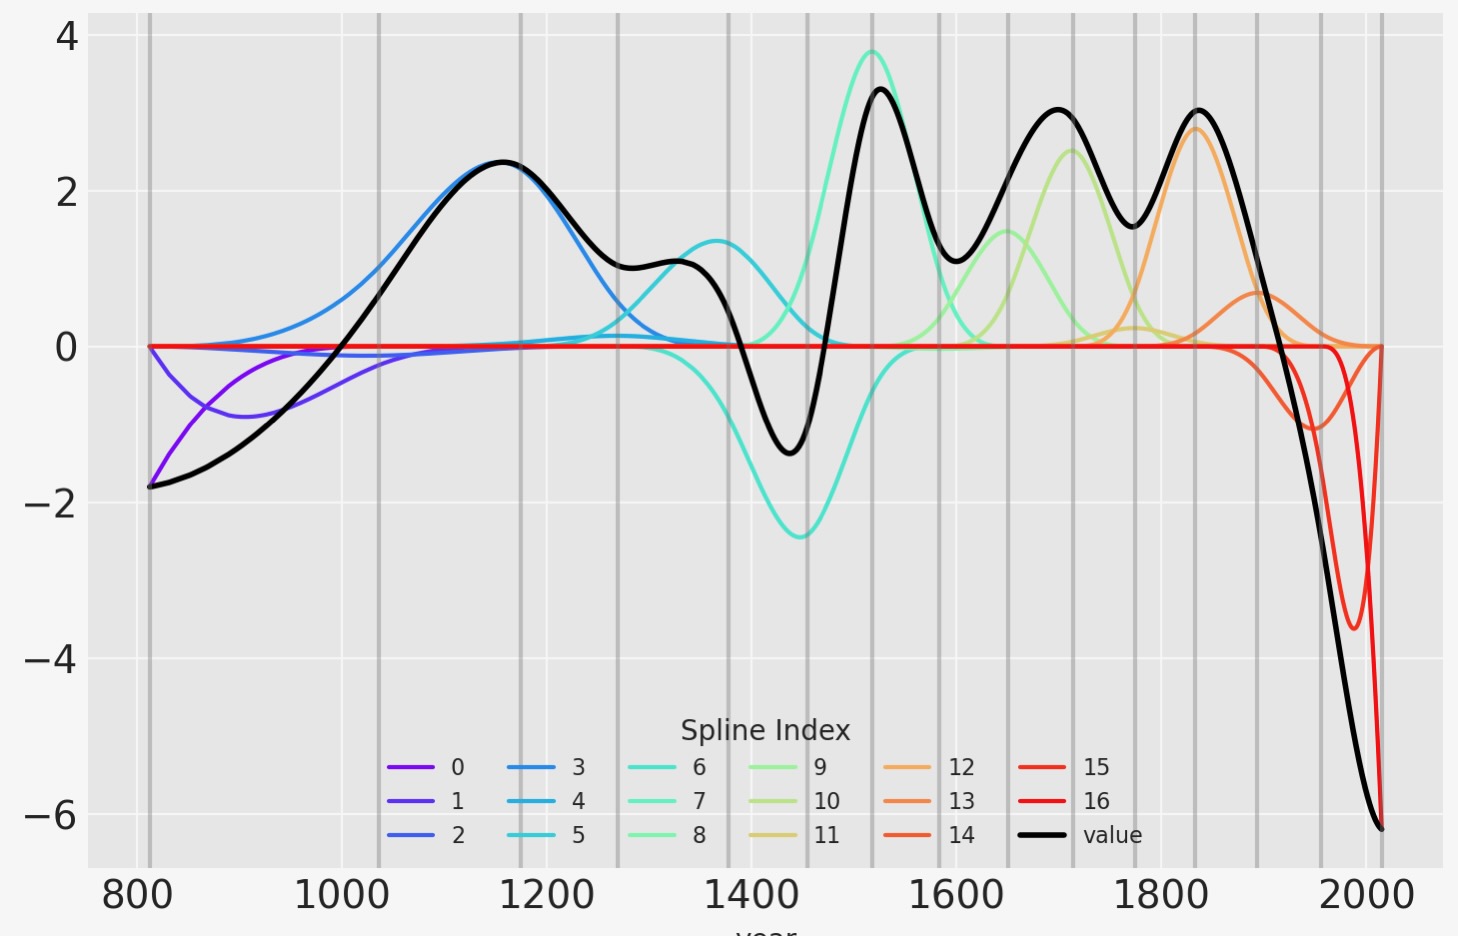
モデルの予測
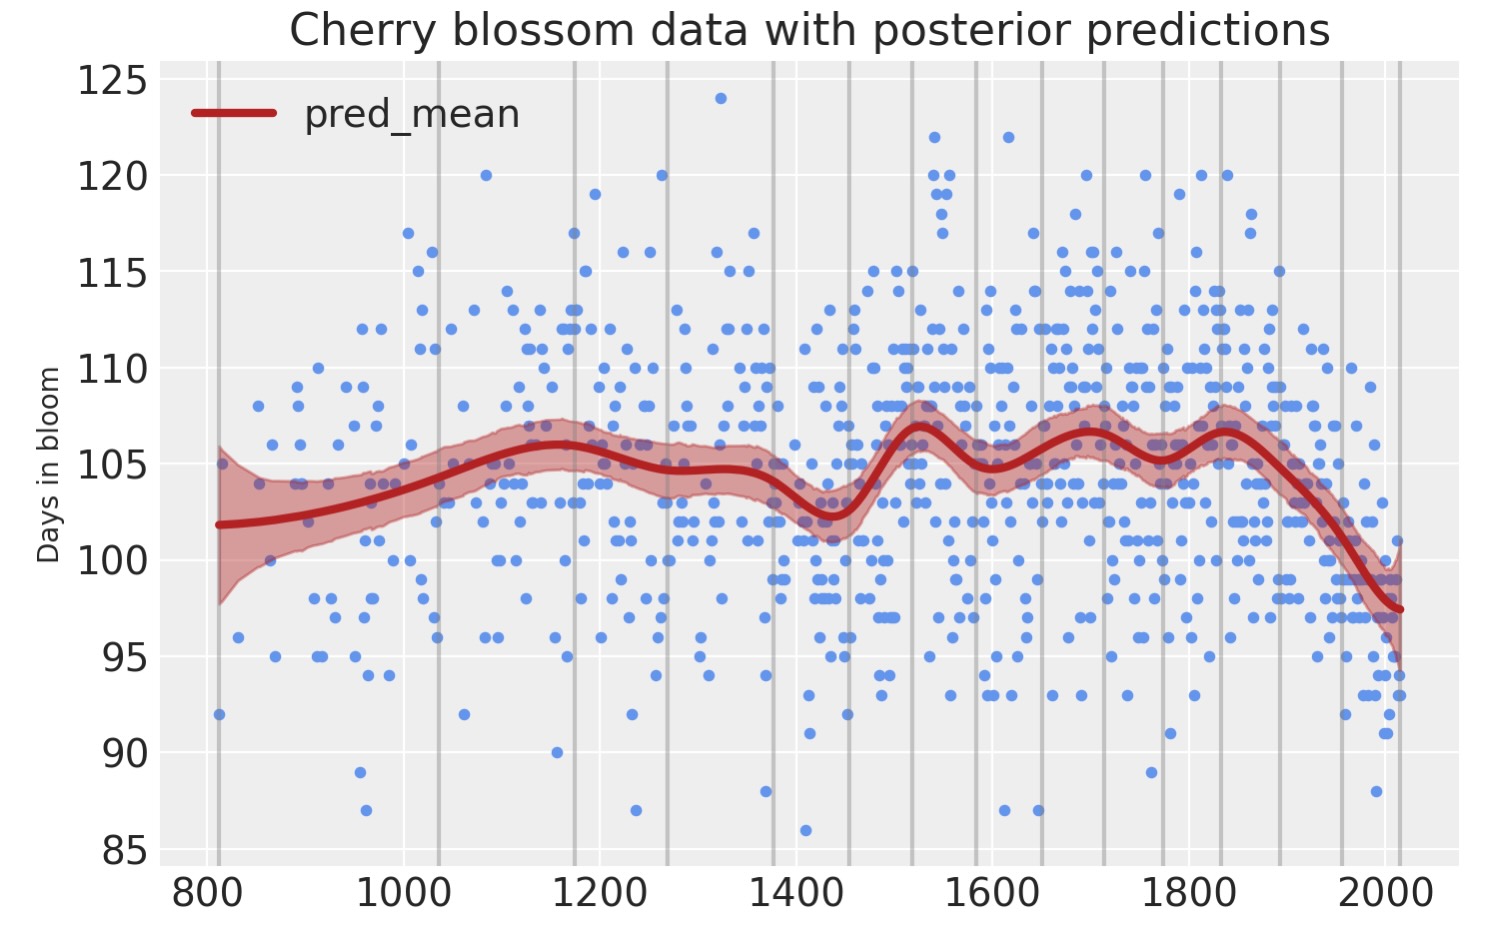
最後に、事後予測チェックを用いてモデルの予測を視覚化できます。
post_pred = az.summary(idata, var_names=["mu"]).reset_index(drop=True)
blossom_data_post = blossom_data.copy().reset_index(drop=True)
blossom_data_post["pred_mean"] = post_pred["mean"]
blossom_data_post["pred_hdi_lower"] = post_pred["hdi_3%"]
blossom_data_post["pred_hdi_upper"] = post_pred["hdi_97%"]
blossom_data.plot.scatter(
"year",
"doy",
color="cornflowerblue",
s=10,
title="Cherry blossom data with posterior predictions",
ylabel="Days in bloom",
)
for knot in knot_list:
plt.gca().axvline(knot, color="grey", alpha=0.4)
blossom_data_post.plot("year", "pred_mean", ax=plt.gca(), lw=3, color="firebrick")
plt.fill_between(
blossom_data_post.year,
blossom_data_post.pred_hdi_lower,
blossom_data_post.pred_hdi_upper,
color="firebrick",
alpha=0.4,
);
参考文献
- Richard McElreath. Statistical rethinking: A Bayesian course with examples in R and Stan. Chapman and Hall/CRC, 2018.
- Osvaldo A Martin, Ravin Kumar, and Junpeng Lao. Bayesian Modeling and Computation in Python. Chapman and Hall/CRC, 2021
製作者
著作 Joshua Cook
更新 Tyler James Burch
更新 Chris Fonnesbeck
産業革命以後、開花時期が早くなっているのがわかります。この桜の開花時期の予測も地球が温暖化している一端が現れている例です。