import arviz as az
import matplotlib.pyplot as plt
import numpy as np
import pandas as pd
import patsy
import pymc as pm
import seaborn as sns

from scipy.special import expit as inverse_logit
from sklearn.metrics import RocCurveDisplay, accuracy_score, auc, roc_curve
from sklearn.model_selection import train_test_split
RANDOM_SEED = 8927
rng = np.random.default_rng(RANDOM_SEED)
az.style.use("arviz-darkgrid")サンプルデータの生成
二つの数値的な特徴が相互に増加するロジスティック回帰モデルを適合させることを望んでいます。
# Number of data points
n = 250
# Create features
x1 = rng.normal(loc=0.0, scale=2.0, size=n)
x2 = rng.normal(loc=0.0, scale=2.0, size=n)
# Define target variable
intercept = -0.5
beta_x1 = 1
beta_x2 = -1
beta_interaction = 2
z = intercept + beta_x1 * x1 + beta_x2 * x2 + beta_interaction * x1 * x2
p = inverse_logit(z)
# note binimial with n=1 is equal to a bernoulli
y = rng.binomial(n=1, p=p, size=n)
df = pd.DataFrame(dict(x1=x1, x2=x2, y=y))
df.head()| x1 | x2 | y | |
|---|---|---|---|
| 0 | -0.445284 | 1.381325 | 0 |
| 1 | 2.651317 | 0.800736 | 1 |
| 2 | -1.141940 | -0.128204 | 0 |
| 3 | 1.336498 | -0.931965 | 0 |
| 4 | 2.290762 | 3.400222 | 1 |
任意の探索を行いましょう。
sns.pairplot(data=df, kind="scatter");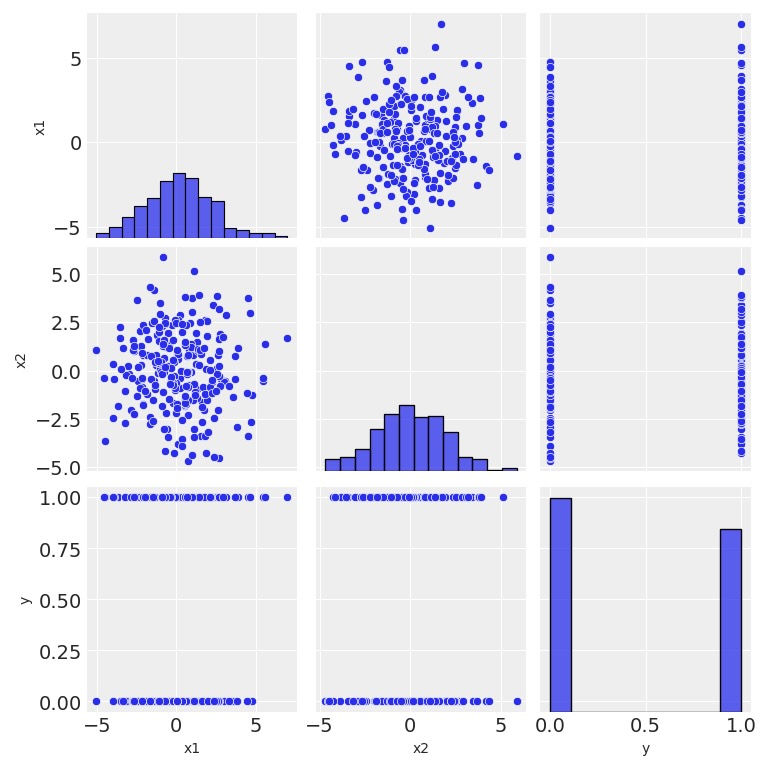
- x1とx2に相関はありません。
- x1とx2は独立してy-クラスから分離しているようではありません。
- yの分布はそれほど不安定ではない。
fig, ax = plt.subplots()
sns.scatterplot(x="x1", y="x2", data=df, hue="y")
ax.legend(title="y")
ax.set(title="Sample Data", xlim=(-9, 9), ylim=(-9, 9));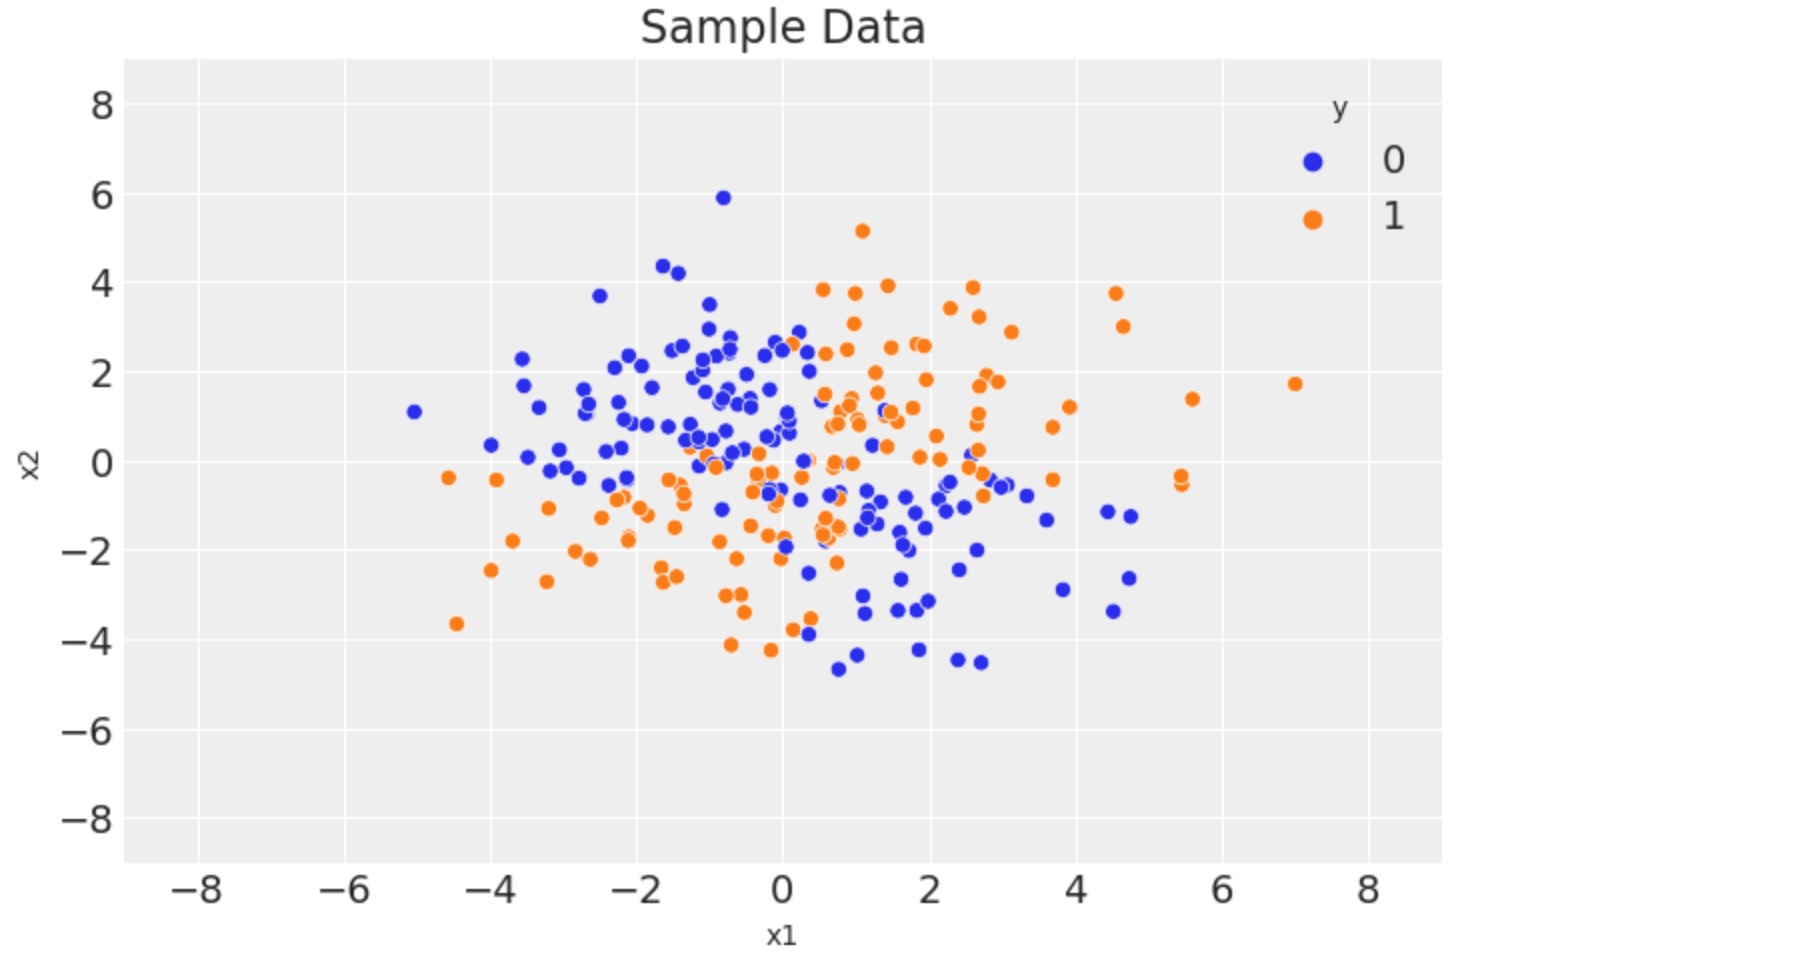
モデル化のためのデータの準備
y, x = patsy.dmatrices("y ~ x1 * x2", data=df)
y = np.asarray(y).flatten()
labels = x.design_info.column_names
x = np.asarray(x)
ここでデータをトレーイング用に分離します。
x_train, x_test, y_train, y_test = train_test_split(x, y, train_size=0.7)モデルの定義と適合
ここでpyMCのモデルを規定します。
COORDS = {"coeffs": labels}

with pm.Model(coords=COORDS) as model:
    # data containers
    X = pm.MutableData("X", x_train)
    y = pm.MutableData("y", y_train)
    # priors
    b = pm.Normal("b", mu=0, sigma=1, dims="coeffs")
    # linear model
    mu = pm.math.dot(X, b)
    # link function
    p = pm.Deterministic("p", pm.math.invlogit(mu))
    # likelihood
    pm.Bernoulli("obs", p=p, observed=y)

pm.model_to_graphviz(model)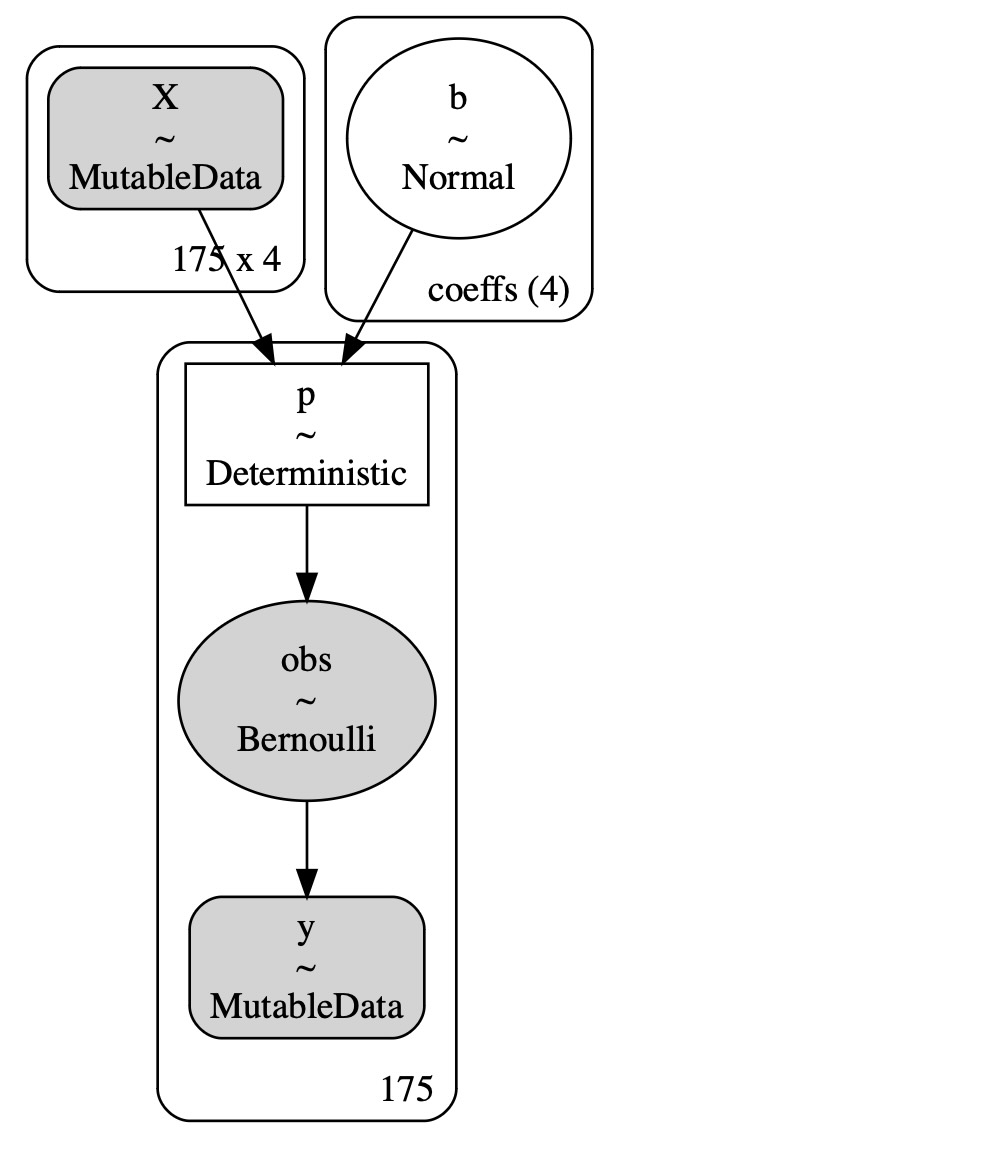
with model:
    idata = pm.sample()
az.plot_trace(idata, var_names="b", compact=False);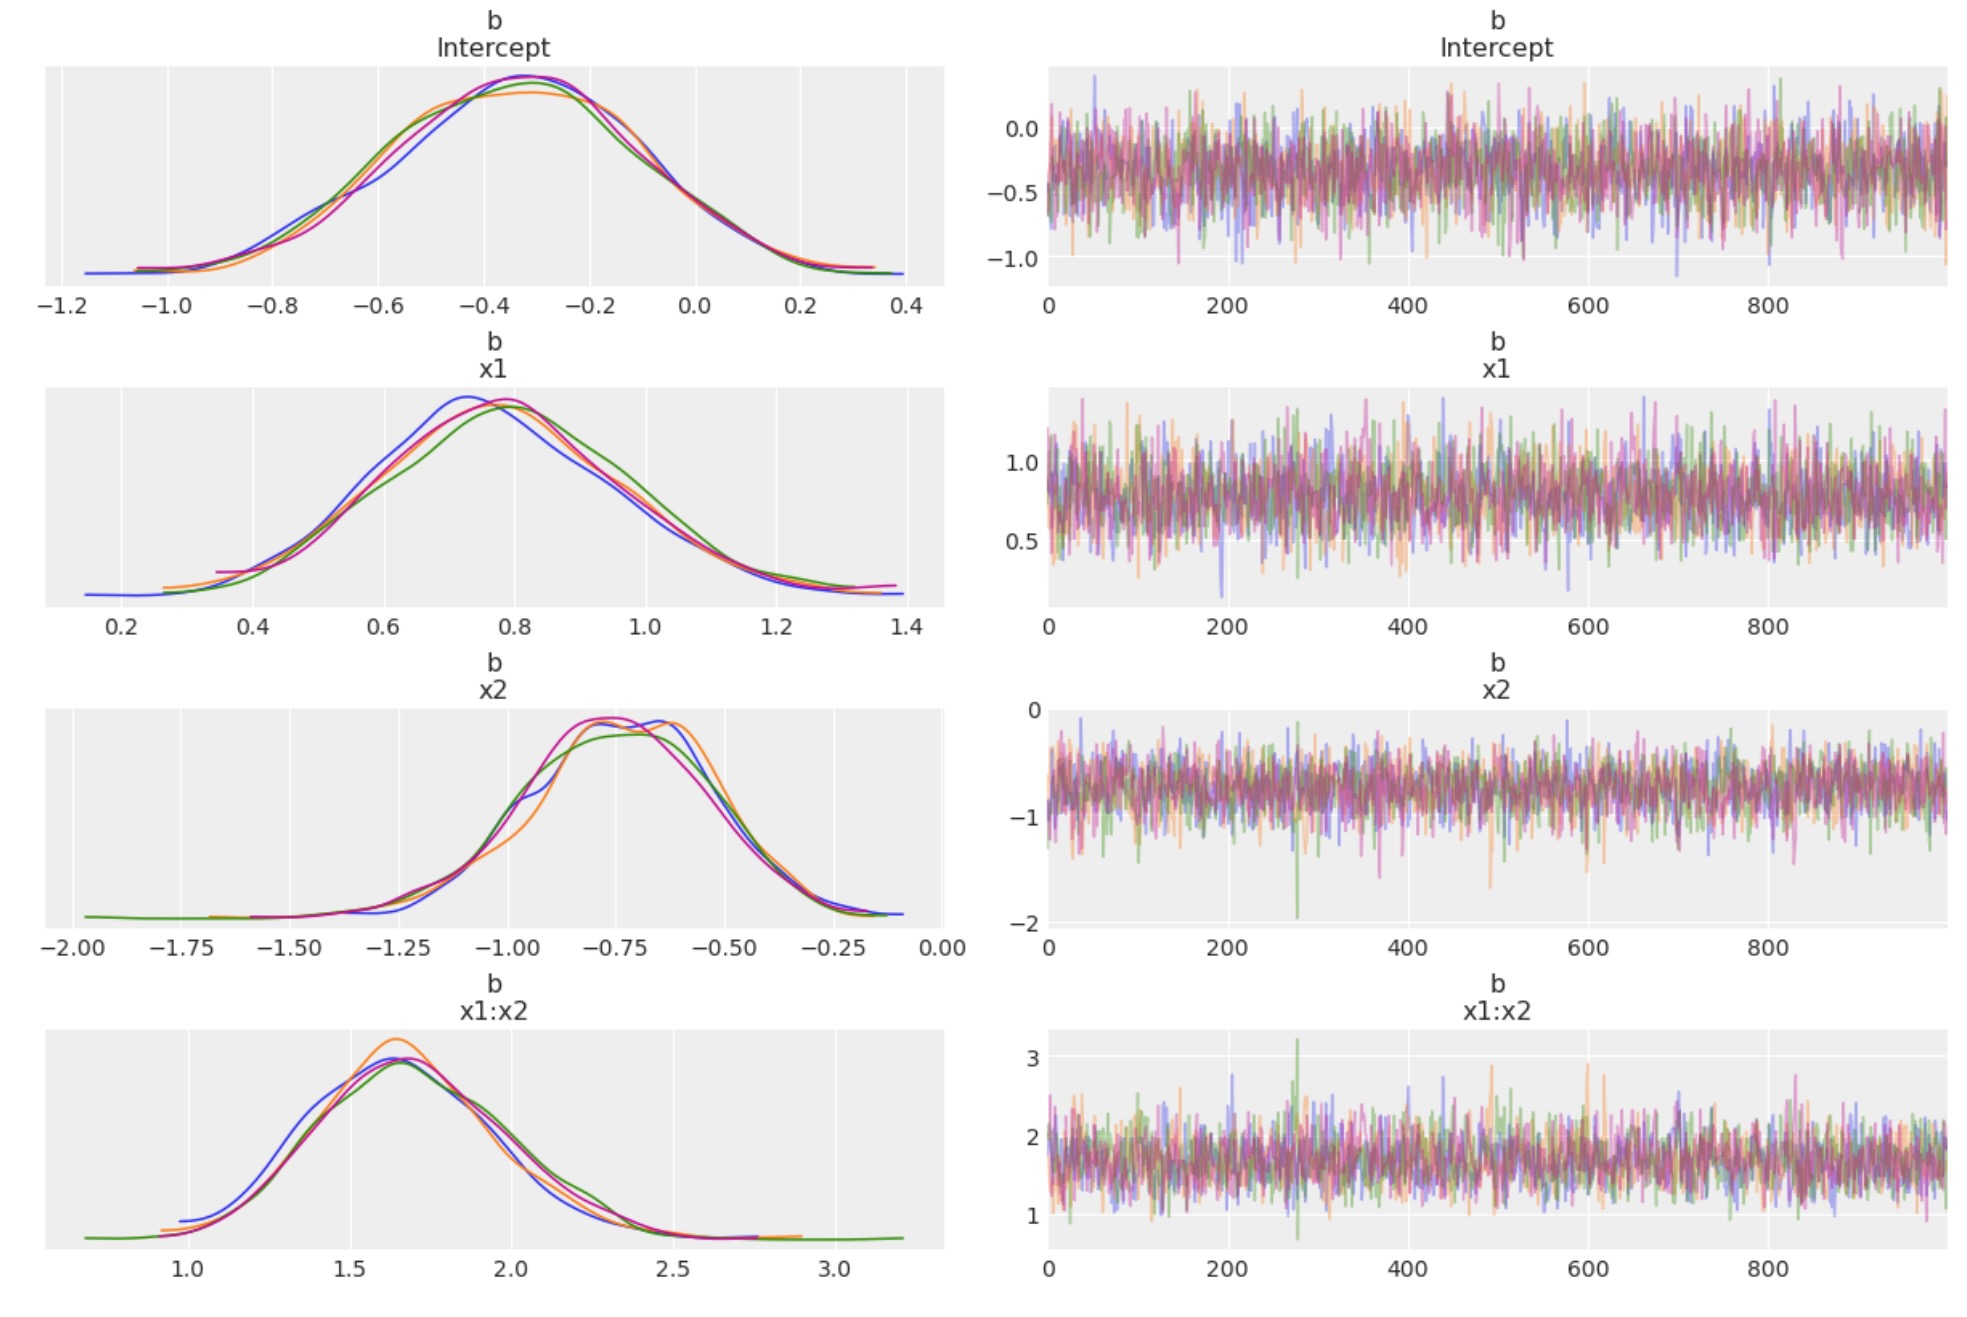
チェインは良いようです。
az.summary(idata, var_names="b")| mean | sd | hdi_3% | hdi_97% | mcse_mean | mcse_sd | ess_bulk | ess_tail | r_hat | |
|---|---|---|---|---|---|---|---|---|---|
| b[Intercept] | -0.340 | 0.234 | -0.780 | 0.082 | 0.004 | 0.003 | 2749.0 | 2828.0 | 1.0 |
| b[x1] | 0.782 | 0.186 | 0.424 | 1.125 | 0.004 | 0.003 | 2405.0 | 2465.0 | 1.0 |
| b[x2] | -0.746 | 0.214 | -1.155 | -0.359 | 0.004 | 0.003 | 2471.0 | 2867.0 | 1.0 |
| b[x1:x2] | 1.685 | 0.289 | 1.181 | 2.253 | 0.007 | 0.005 | 1946.0 | 2227.0 | 1.0 |
このシミュレートしたデータの真のパラメータの回復はよく働いています。
az.plot_posterior(
    idata, var_names=["b"], ref_val=[intercept, beta_x1, beta_x2, beta_interaction], figsize=(15, 4)
);
サンプルを分離する予測の生成
テストセットの予測を生成します。
with model:
    pm.set_data({"X": x_test, "y": y_test})
    idata.extend(pm.sample_posterior_predictive(idata))
# Compute the point prediction by taking the mean and defining the category via a threshold.
p_test_pred = idata.posterior_predictive["obs"].mean(dim=["chain", "draw"])
y_test_pred = (p_test_pred >= 0.5).astype("int")
モデルの評価
最初に、テストセットの正確さを計算します。
print(f"accuracy = {accuracy_score(y_true=y_test, y_pred=y_test_pred): 0.3f}")accuracy = 0.880次に aucを計算して、roc curveを図示します。
fpr, tpr, thresholds = roc_curve(
    y_true=y_test, y_score=p_test_pred, pos_label=1, drop_intermediate=False
)
roc_auc = auc(fpr, tpr)

fig, ax = plt.subplots()
roc_display = RocCurveDisplay(fpr=fpr, tpr=tpr, roc_auc=roc_auc)
roc_display = roc_display.plot(ax=ax, marker="o", markersize=4)
ax.set(title="ROC");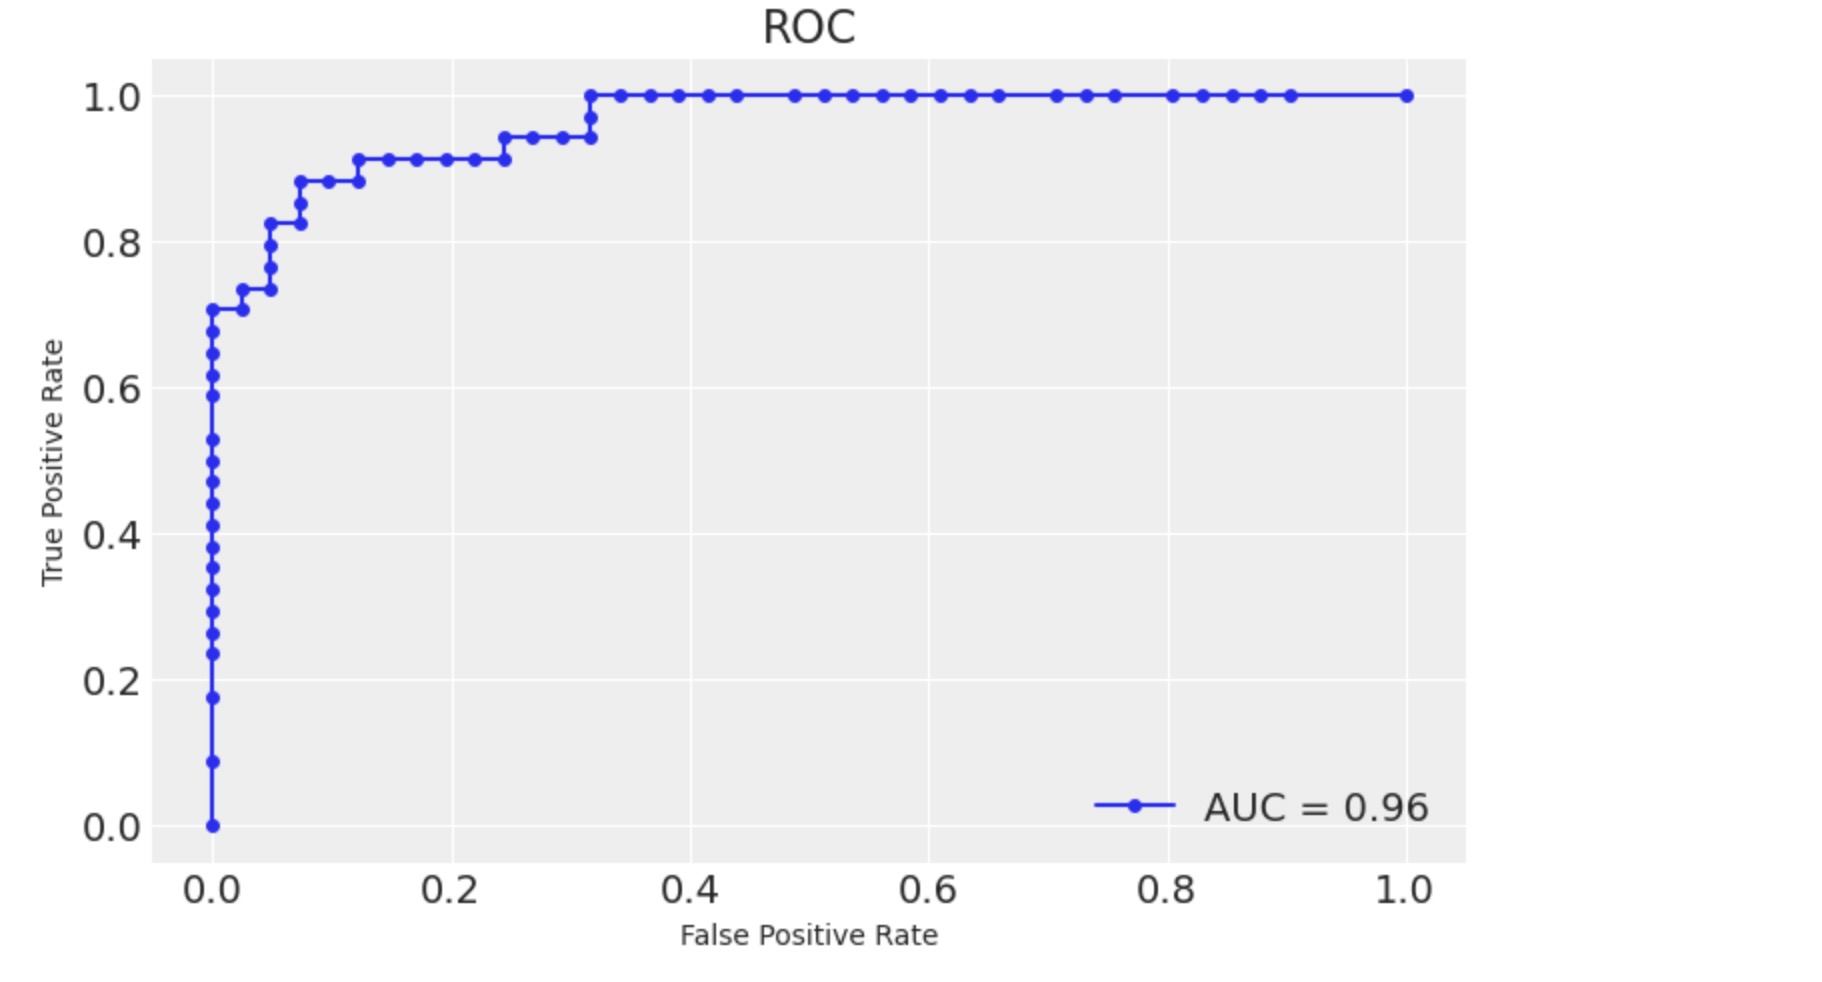
モデルは予期した通りに実行しています()私たちは、もちろん、データ生成過程がわかっており、そのほとんどは、実際の応用のケースではありません。
モデルの決定境界
最後に、モデルの決定境界を図示して記述します。それは、以下のように定義される空間です。

ここでpはモデルによってクラスy=1に属する確率を示し、このセットを明確にするために、私たちは、簡単にモデルのパラメータ項の条件を記します。

ここで暗黙に

x2を解決するために、次の公式

この曲線は、特異点 x1 = -β2 /β12 を中心とした双曲線となることを観測します。
ここでグリッドを用いてモデルの決定境界を図示しましょう。
def make_grid():
    x1_grid = np.linspace(start=-9, stop=9, num=300)
    x2_grid = x1_grid
    x1_mesh, x2_mesh = np.meshgrid(x1_grid, x2_grid)
    x_grid = np.stack(arrays=[x1_mesh.flatten(), x2_mesh.flatten()], axis=1)
    return x1_grid, x2_grid, x_grid


x1_grid, x2_grid, x_grid = make_grid()

with model:
    # Create features on the grid.
    x_grid_ext = patsy.dmatrix(formula_like="x1 * x2", data=dict(x1=x_grid[:, 0], x2=x_grid[:, 1]))
    x_grid_ext = np.asarray(x_grid_ext)
    # set the observed variables
    pm.set_data({"X": x_grid_ext})
    # calculate pushforward values of `p`
    ppc_grid = pm.sample_posterior_predictive(idata, var_names=["p"])
# grid of predictions
grid_df = pd.DataFrame(x_grid, columns=["x1", "x2"])
grid_df["p"] = ppc_grid.posterior_predictive.p.mean(dim=["chain", "draw"])
p_grid = grid_df.pivot(index="x2", columns="x1", values="p").to_numpy()
ここで、視覚化のためにグリッド上でモデル決定境界を計算します。
def calc_decision_boundary(idata, x1_grid):
    # posterior mean of coefficients
    intercept = idata.posterior["b"].sel(coeffs="Intercept").mean().data
    b1 = idata.posterior["b"].sel(coeffs="x1").mean().data
    b2 = idata.posterior["b"].sel(coeffs="x2").mean().data
    b1b2 = idata.posterior["b"].sel(coeffs="x1:x2").mean().data
    # decision boundary equation
    return -(intercept + b1 * x1_grid) / (b2 + b1b2 * x1_grid)
ついにテストセットの予測と図を取得します。
fig, ax = plt.subplots()

# data
sns.scatterplot(
    x=x_test[:, 1].flatten(),
    y=x_test[:, 2].flatten(),
    hue=y_test,
    ax=ax,
)

# decision boundary
ax.plot(x1_grid, calc_decision_boundary(idata, x1_grid), color="black", linestyle=":")

# grid of predictions
ax.contourf(x1_grid, x2_grid, p_grid, alpha=0.3)

ax.legend(title="y", loc="center left", bbox_to_anchor=(1, 0.5))
ax.set(title="Model Decision Boundary", xlim=(-9, 9), ylim=(-9, 9), xlabel="x1", ylabel="x2");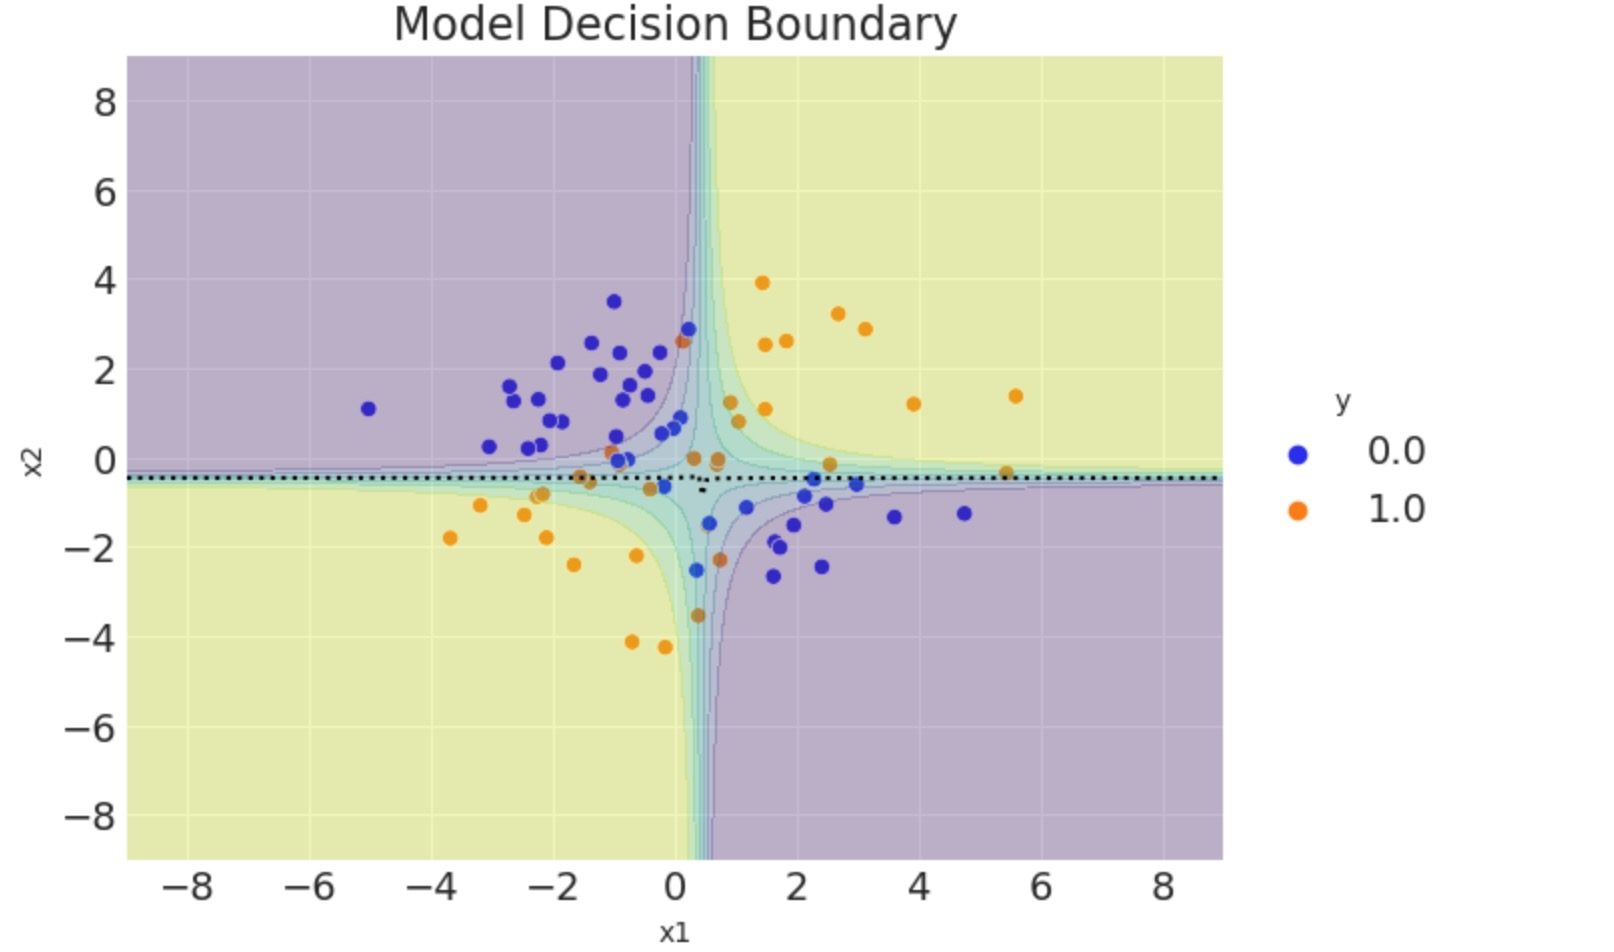
事後サンプルの平均を使うことによって、モデルの決定境界を計算しました。しかし、私たちが、(精度とAUCのような他の測定と同じように)完全な分布を使えるならば、(より情報のある)もっとよく生成できます。
参考文献
- Bayesian Analysis with Python 2nd edtion - Chapter4
- Statistical Rethnking
製作者
著作:Juan Orduz
更新:Benjamin T. Vincent 2022年6月 PyMC v4
更新:Benjamin T.Vincent 2022年12月 PyMC v5