SVMは、分類、回帰、外れ値検出に使用するスーパバイザー学習メソッド(教師あり学習)のセットです。
分類
SVM 最大差分ハイパープレーン
SVM分類を使って二つに分類できるデータセットに最大差分ハイパープレーンを図示したものです。
import matplotlib.pyplot as plt
from sklearn import svm
from sklearn.datasets import make_blobs
from sklearn.inspection import DecisionBoundaryDisplay


# we create 40 separable points
X, y = make_blobs(n_samples=40, centers=2, random_state=6)

# fit the model, don't regularize for illustration purposes
clf = svm.SVC(kernel="linear", C=1000)
clf.fit(X, y)

plt.scatter(X[:, 0], X[:, 1], c=y, s=30, cmap=plt.cm.Paired)

# plot the decision function
ax = plt.gca()
DecisionBoundaryDisplay.from_estimator(
    clf,
    X,
    plot_method="contour",
    colors="k",
    levels=[-1, 0, 1],
    alpha=0.5,
    linestyles=["--", "-", "--"],
    ax=ax,
)
# plot support vectors
ax.scatter(
    clf.support_vectors_[:, 0],
    clf.support_vectors_[:, 1],
    s=100,
    linewidth=1,
    facecolors="none",
    edgecolors="k",
)
plt.show()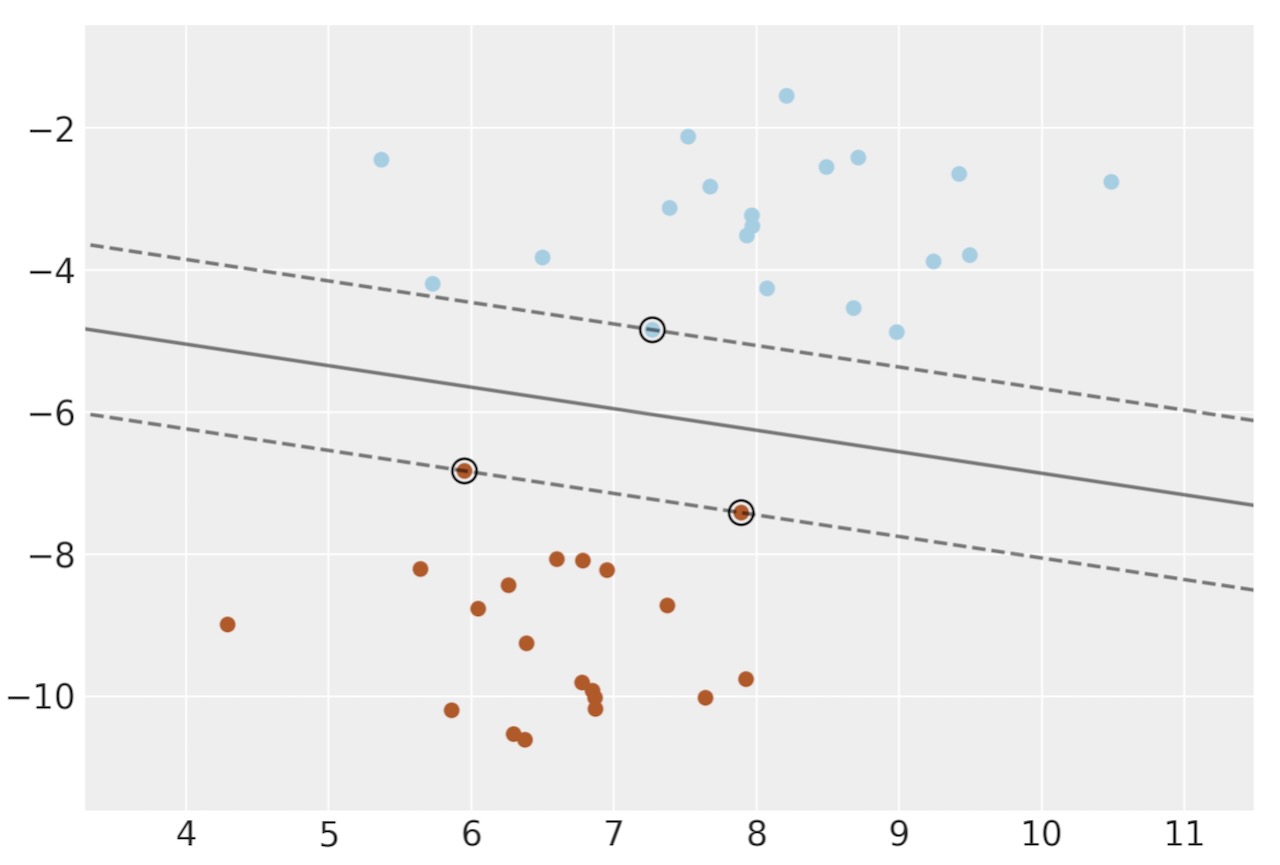
回帰
線形、多項式、RBFカーネルを使った回帰の例
import numpy as np
from sklearn.svm import SVR
import matplotlib.pyplot as plt
サンプルデータの生成
X = np.sort(5 * np.random.rand(40, 1), axis=0)
y = np.sin(X).ravel()

# add noise to targets
y[::5] += 3 * (0.5 - np.random.rand(8))
線形モデルのフィット
svr_rbf = SVR(kernel="rbf", C=100, gamma=0.1, epsilon=0.1)
svr_lin = SVR(kernel="linear", C=100, gamma="auto")
svr_poly = SVR(kernel="poly", C=100, gamma="auto", degree=3, epsilon=0.1, coef0=1)
結果の表示
lw = 2

svrs = [svr_rbf, svr_lin, svr_poly]
kernel_label = ["RBF", "Linear", "Polynomial"]
model_color = ["m", "c", "g"]

fig, axes = plt.subplots(nrows=1, ncols=3, figsize=(15, 10), sharey=True)
for ix, svr in enumerate(svrs):
    axes[ix].plot(
        X,
        svr.fit(X, y).predict(X),
        color=model_color[ix],
        lw=lw,
        label="{} model".format(kernel_label[ix]),
    )
    axes[ix].scatter(
        X[svr.support_],
        y[svr.support_],
        facecolor="none",
        edgecolor=model_color[ix],
        s=50,
        label="{} support vectors".format(kernel_label[ix]),
    )
    axes[ix].scatter(
        X[np.setdiff1d(np.arange(len(X)), svr.support_)],
        y[np.setdiff1d(np.arange(len(X)), svr.support_)],
        facecolor="none",
        edgecolor="k",
        s=50,
        label="other training data",
    )
    axes[ix].legend(
        loc="upper center",
        bbox_to_anchor=(0.5, 1.1),
        ncol=1,
        fancybox=True,
        shadow=True,
    )

fig.text(0.5, 0.04, "data", ha="center", va="center")
fig.text(0.06, 0.5, "target", ha="center", va="center", rotation="vertical")
fig.suptitle("Support Vector Regression", fontsize=14)
plt.show()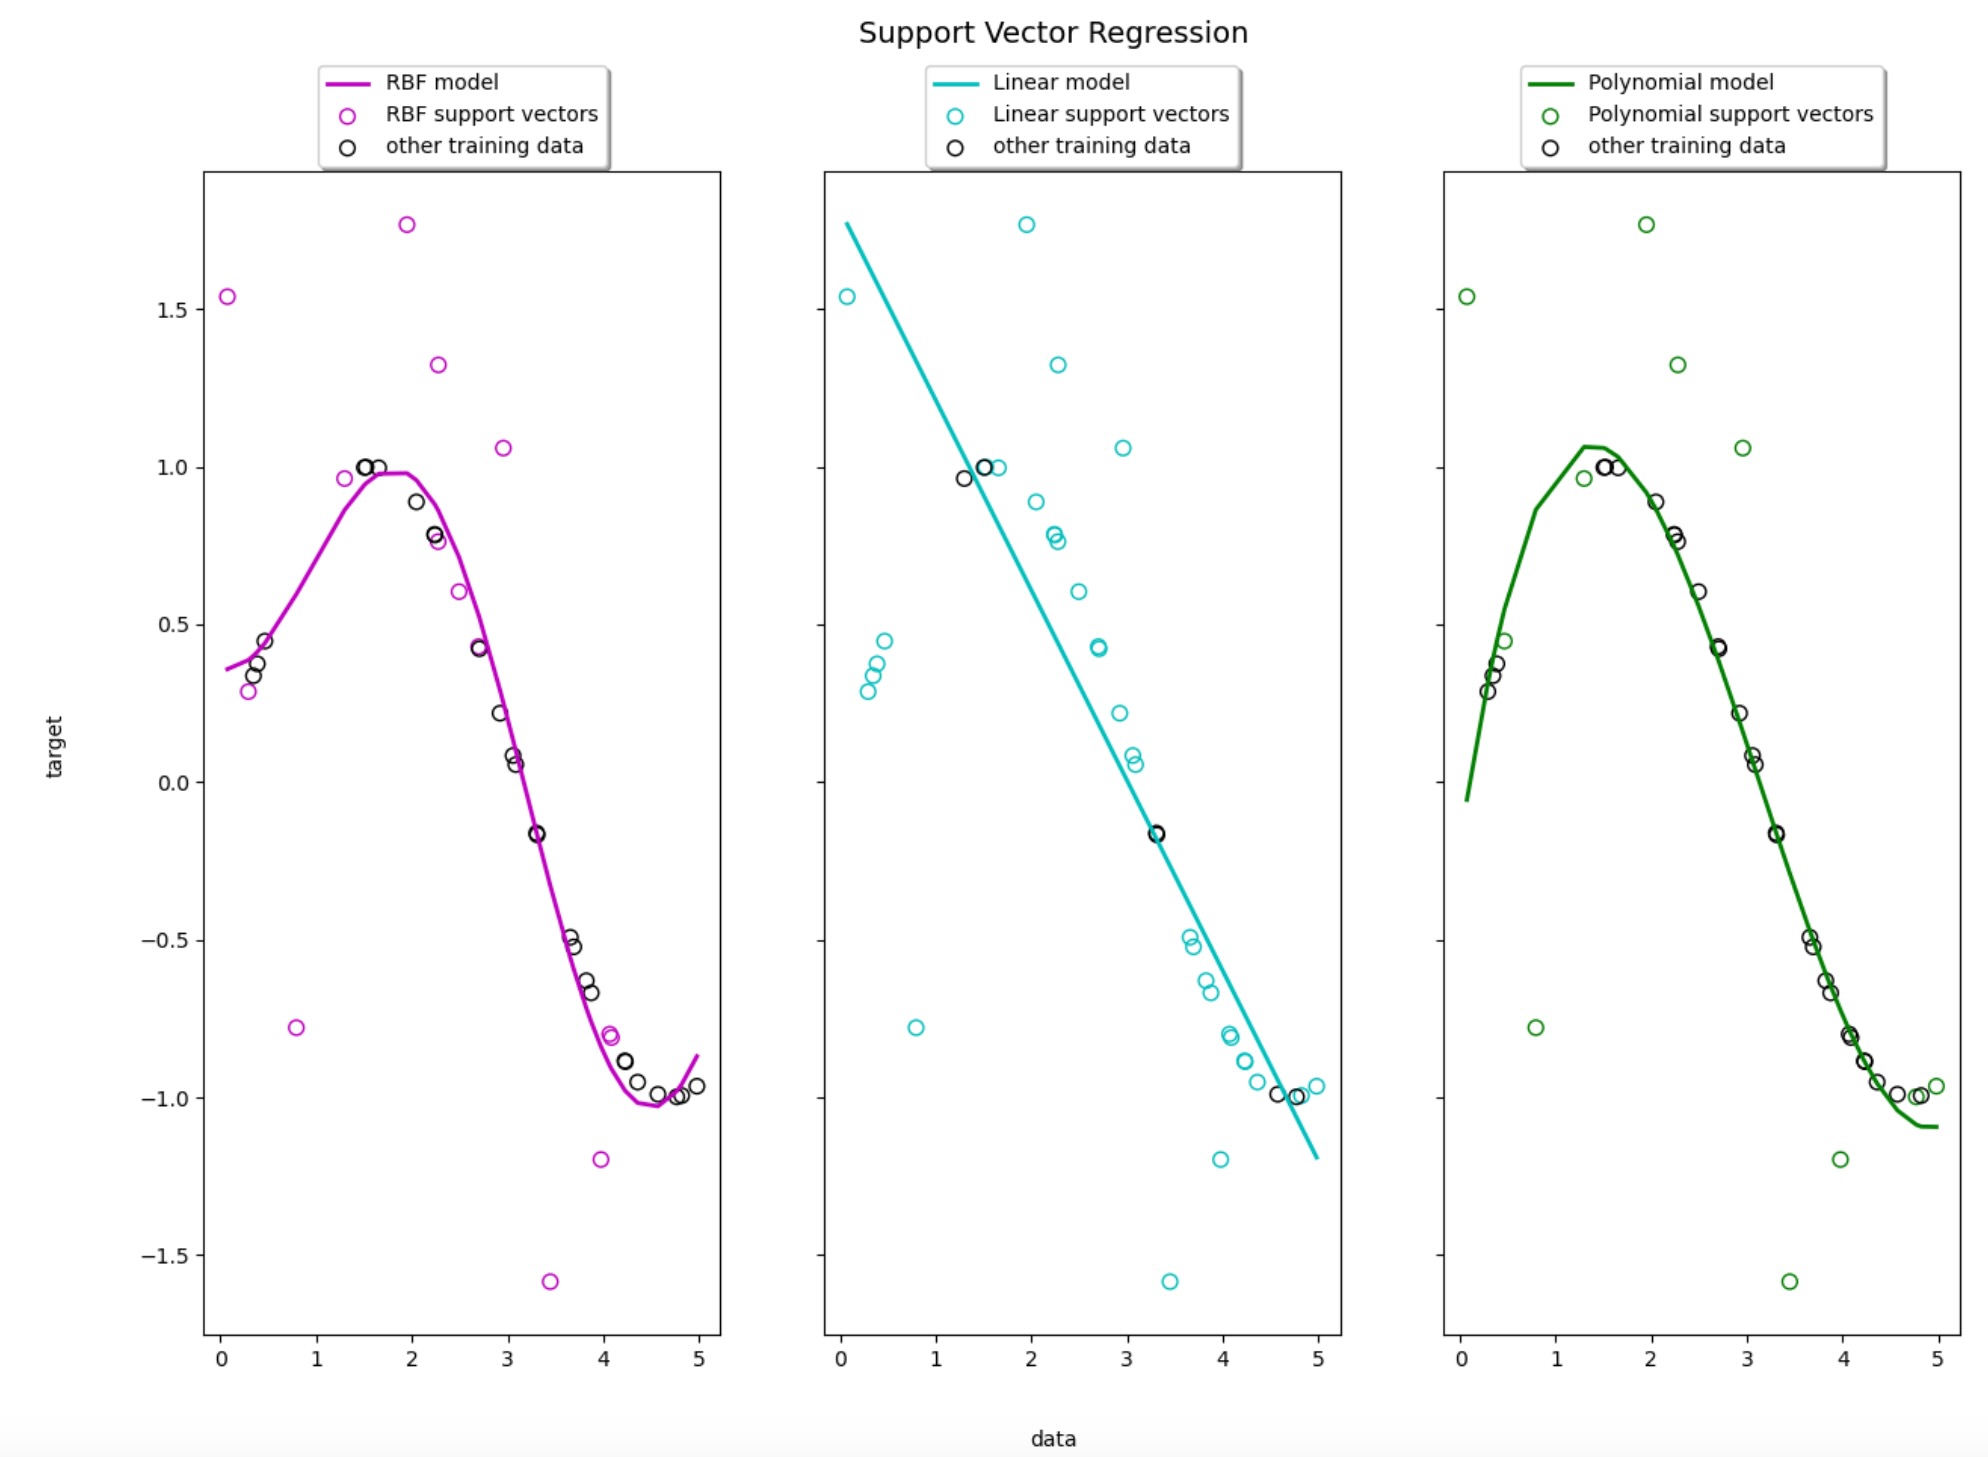
外れ値検出
外れ値検知などの異常検知を扱うクラスとして One-Class SVMが実装されています。使用例は目新しさ(Novelty) 検知を参照してください。

のセットです。 分類 SVM 最大差分ハイパープレーン SVM分類を使って二つに分類できるデータセットに最大差分ハ)